Inside18yard is back and this fall we are “going data!” in our articles. This blog in particular focuses on a comparison of top European leagues using Descriptive Statistics.
The 2015-16 season for the European football was an exciting one and even more so for the English Premier League. ‘He just did a Leicester’ has become the catch phrase after we saw, certainly, the greatest underdog story of all time in a team sport and perhaps even in all of sporting history. Leicester City in previous season, after being at the bottom of the table as late as April 2014 with just 9 matches to go and facing a very real threat of relegation somehow managed to keep their place in the Premier League. And it will be unfair to call what happened afterwards as anything less than a fairy tale.
Leicester City FC in the next season, against the 5000:1 odds given to them by bookmakers, went on to win the title against the likes of Spurs, Arsenal and the mighty Manchester Clubs. To wrap your head around the achievement one has to see that the last time any club outside Big 5 won the Premier League was in 1994-95 while there was still some economic parity between the teams.
More impressive is their away goals records. Let us look at how do the numbers tally against the winners of La Liga, Bundesliga and Serie A.

The bar plots above show Leicester has been pretty consistent. Irrespective of whether they were playing at their home King Power Stadium or away, they averaged around 1.75 goals per game.

Also, they have fared well in the number of fouls committed. But this is only half the picture as the playing style in the leagues vary and the referees tend to give more fouls in Spain.
But now we move away from focusing on just winners and rather we will try to investigate how the four leagues compare to each other on an overall level. More interestingly, we wish to add a temporal dimension to the analysis by looking at the trend of key metrics like Fouls, Yellow/Red Cards, Shots on Target and Goals over the last decade for the top 4 EU leagues.

There is a visibly evident difference in the fouls committed between the four leagues. Probably, teams in Serie-A because of the inherent defensive playing style associated with Italian sides tend to commit more fouls. Another interesting observation is that the number of fouls have been declining steadily over the years. Perhaps, teams in the mid 2000’s had more violent playing style or referees gave out more fouls back then. Who knows?
We cannot comment on the reason from this data. Nevertheless, an interesting observation.
The trends of total Yellow Cards and Red Cards given by referees also reveal some insights.
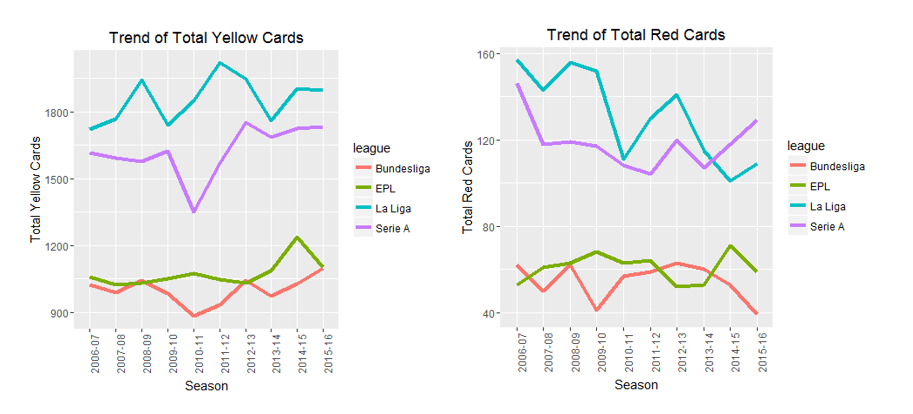
We see despite greater number of fouls being committed in Serie A than La Liga, the referees in Italy have given out much less Yellow Cards and Red Cards than their counterparts in Spain. Similar can also be observed for EPL and Bundesliga.
Secondly, the more obvious observation is that there is a visibly evident difference in the number of Red Cards and Yellow Cards given out by referees between these countries. This does tell us something about playing style in these countries. While more tussle is acceptable in England and Germany, the Spanish and Italian referees tend to be stricter.
Another metric to comment upon the playing style in these countries is by looking at the trend of total shots on target over the last decade.
 Quite clearly the La Liga and Serie-A teams are much more clinical in front of goal than EPL teams. English game is faster and intense but players tend to misfire their shots.
Or perhaps, the second possibility is that EPL teams have better goalkeepers??
Hope, we were able to present some interesting insights from the data on how the top EU football leagues compare against each other. We will be back with more fun reads for the loyal readers of Inside18yard. Stay tuned!!
Data Source – http://www.football-data.co.uk/spainm.php
